Why Value Management


Turn the value you promised into value your customers can measure.

Every customer signed a business case. Almost none of them can tell you whether it came true.

Value is promised in the deal, then quietly abandoned at handover. Post-sales inherits a logo, not a business case, so the conversation drifts to tickets, usage and tactical QBR emails, and by renewal nobody on either side can name the outcome that was bought.

Our goal is realized value with new and existing customers: an outcome agreed with the customer, tracked as a live plan, evidenced with their own numbers, and used as the basis for renewal and expansion. That is what moves NRR.
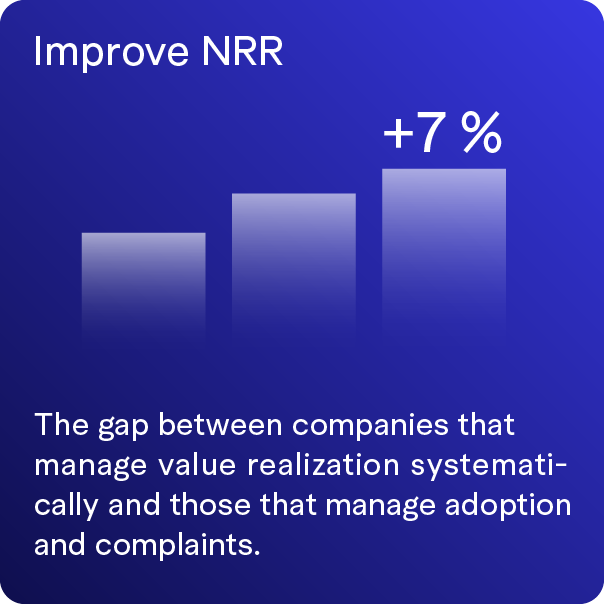
Bar chart showing a 7% increase in improving NRR, with a caption about the gap between companies that manage value realization systematically and those that manage adoption and complaints.
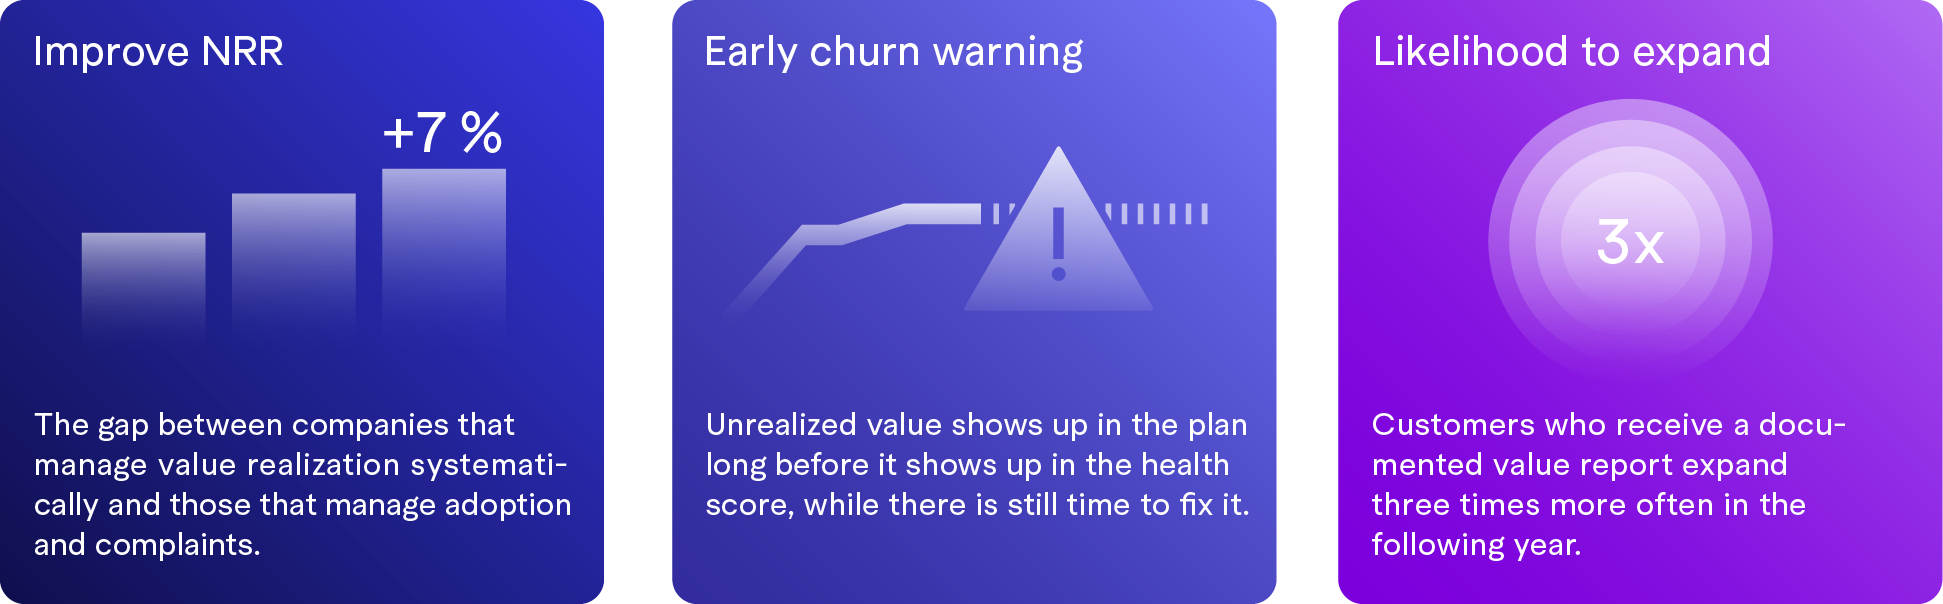
A presentation slide with three sections. The first section shows a bar chart indicating a 7% increase, titled 'Improve NRR' with the text 'The gap between companies that manage value realization systematically and those that manage adoption and complaints.' The second section displays a line graph with an exclamation mark warning about early churn, with the text explaining unrealized value impacts planning and health scores. The third section features a purple concentric circle graphic with '3x' in the center, titled 'Likelihood to expand,' and states that customers receiving a documented value report are three times more likely to expand in the following year.
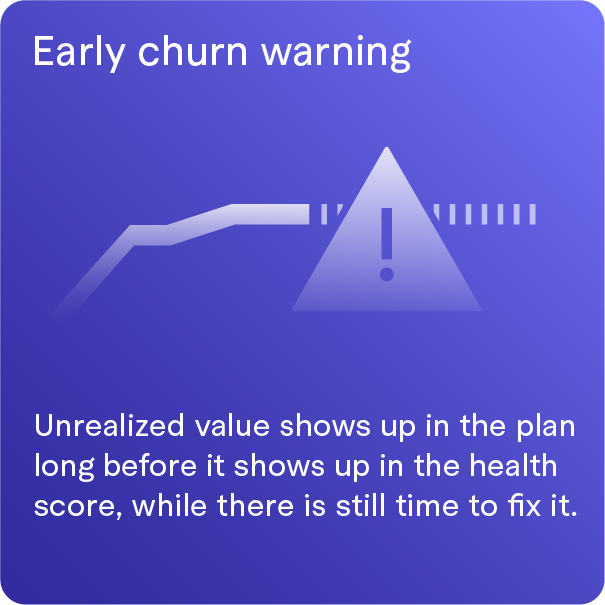
A warning sign for early churn, with text explaining that unrealized value appears in the plan before it shows in the health score, indicating an issue to fix.
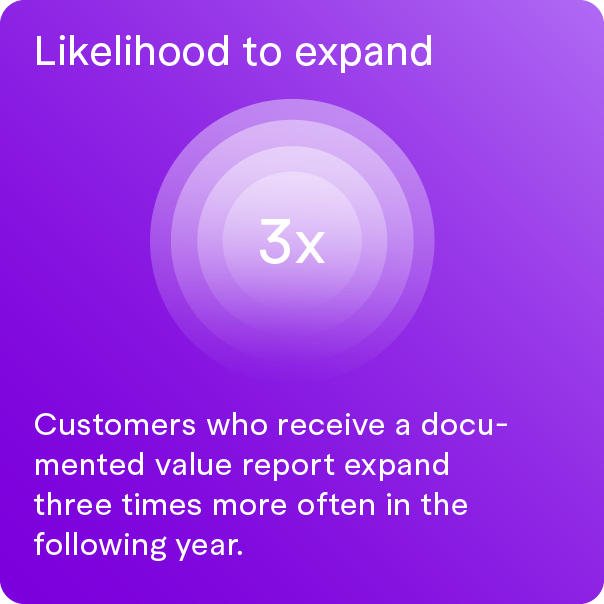
A purple-colored infographic showing that customers who receive a documented value report are three times more likely to expand their engagement in the following year.
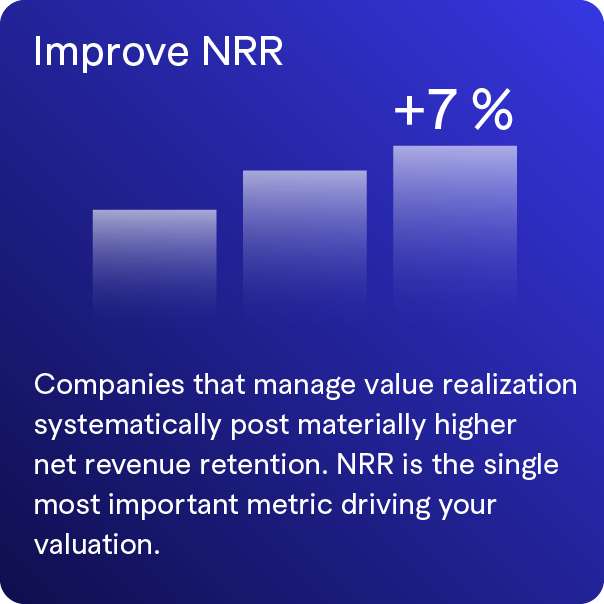
A slide about improving net revenue retention (NRR) with a bar graph showing increasing bars and a +7% label. Text explains companies managing value realization systematically post higher net revenue retention, with NRR as a key metric.
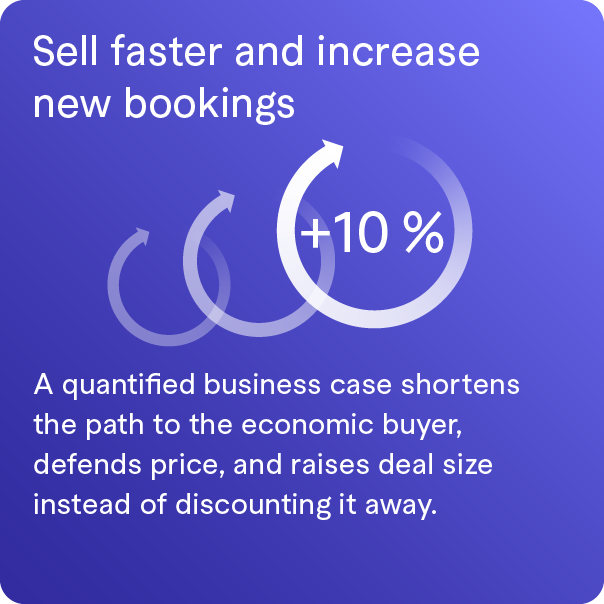
A blue gradient graphic with white text that says "Sell faster and increase new bookings" and a visual of three white upward arrows, the largest with a +10% label, accompanied by smaller arrows, and a paragraph explaining business case benefits for economic buyers.
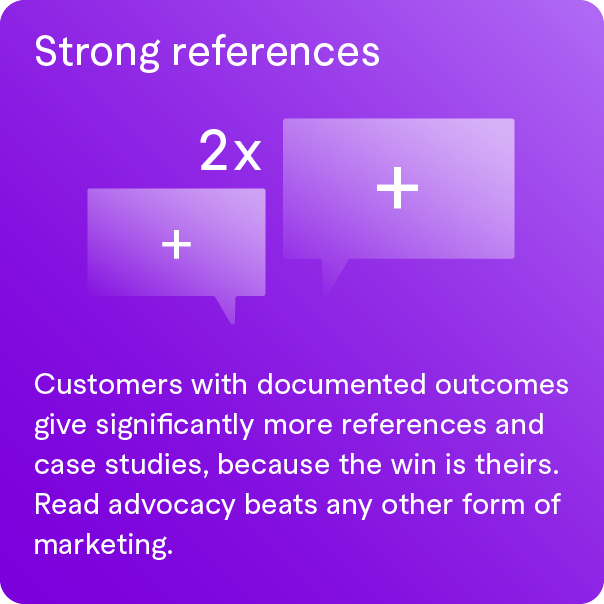
Purple background with text and speech bubble icons. The text reads, "Strong references," "2x," and a paragraph about customers with documented outcomes giving more references and case studies, emphasizing advocacy and marketing effectiveness.

How we do it


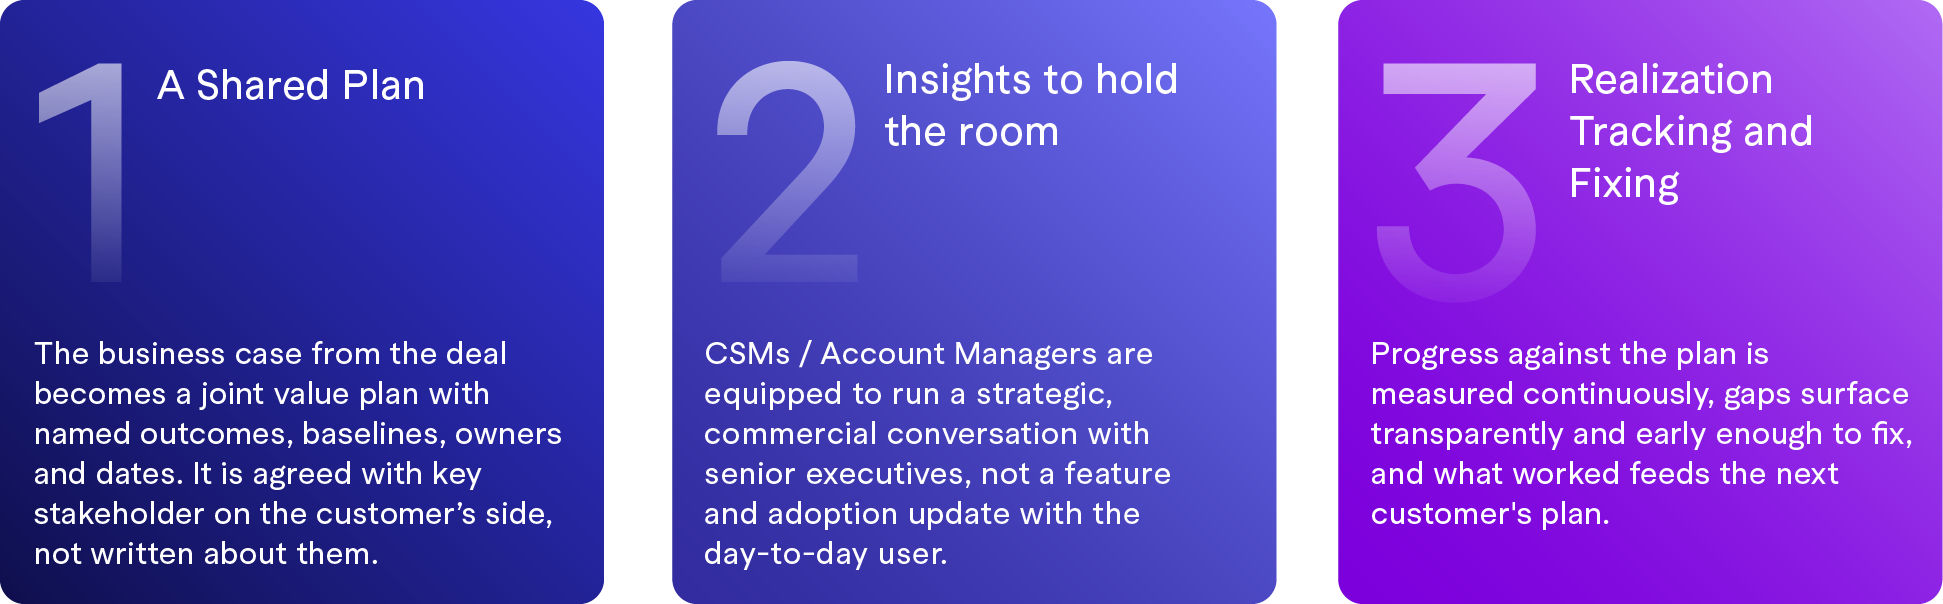
In order to answer the questions “Did we deliver the value we promised, and can we prove it?”, three fundamental measures are installed:
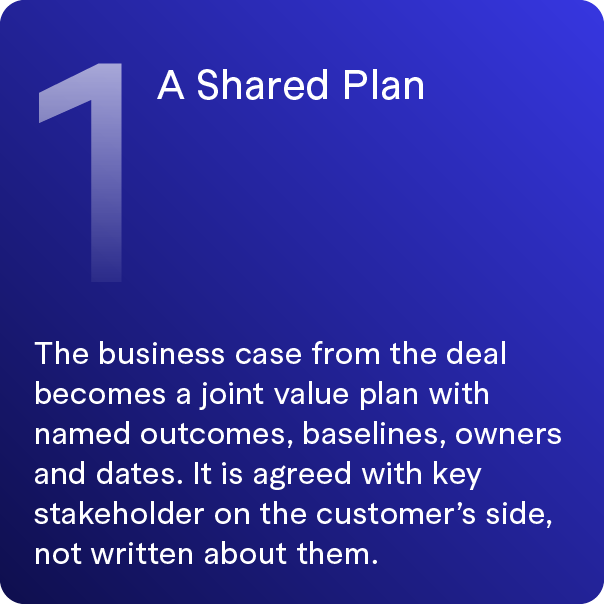
Slide titled 'A Shared Plan' with text about creating a joint value plan from a business deal, including outcomes, baselines, owners, and dates, agreed upon with key stakeholders.
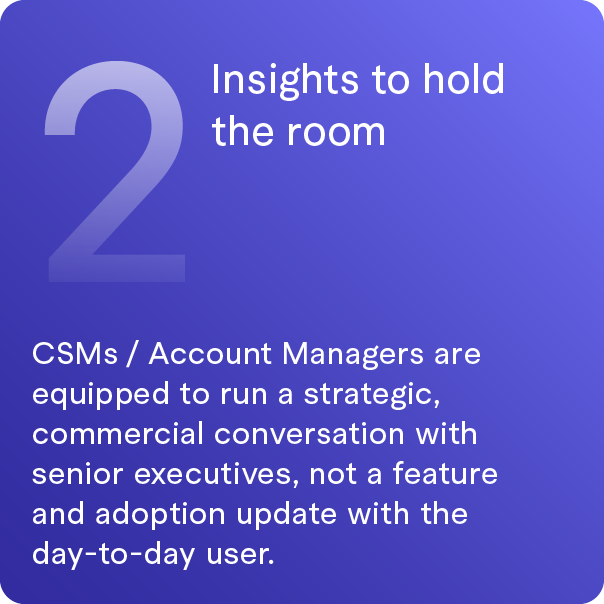
Slide with large number 2 and text: "Insights to hold the room. CSMs / Account Managers are equipped to run a strategic, commercial conversation with senior executives, not a feature and adoption update with the day-to-day user."
A three-step business strategy presentation slide with numbered sections on a gradient background, from 1 to 3, each with descriptive text about planning, insights, and tracking.
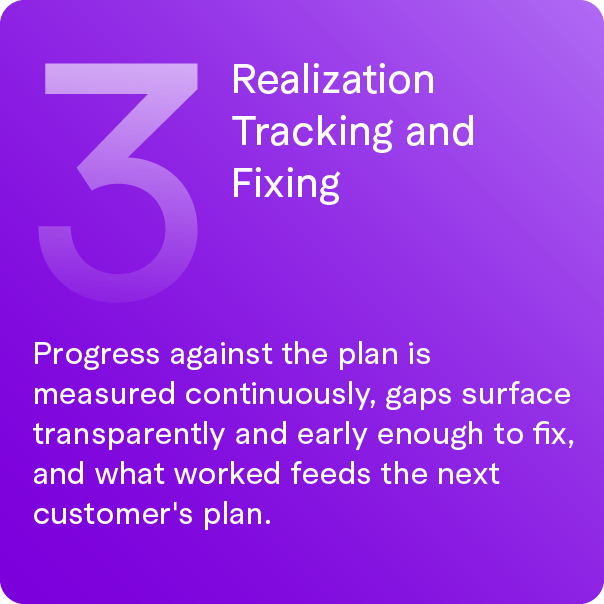
Step 3 of a process: Realization, Tracking, and Fixing, with a purple gradient background and white text explaining the importance of continuous progress measurement and transparent gap identification for customer plan adjustments.

What it looks like in practice


A shared playbook, a platform to run it and a database that makes every future customer easier.

A whiteboard with colorful sticky notes arranged in categories such as Goals, Backlog, and Done, with a group of five blurred people standing and talking in an office setting in the background.
A group of people standing and talking in a bright office space with large windows, with a whiteboard filled with colorful sticky notes related to project goals and tasks.

01 – The collaborative Playbook

Today’s live view, not a slide from last quarter

Every account's promised outcomes, baselines, milestones and current realization in one view. Sales, CS and the customer look at the same picture, and it is never out of date.

  • Promised value vs. realized value, per outcome

  • Clear action to be taken with target dates and named owners on both sides

  • Customer-ready view for the value review, no deck to be rebuilt each time
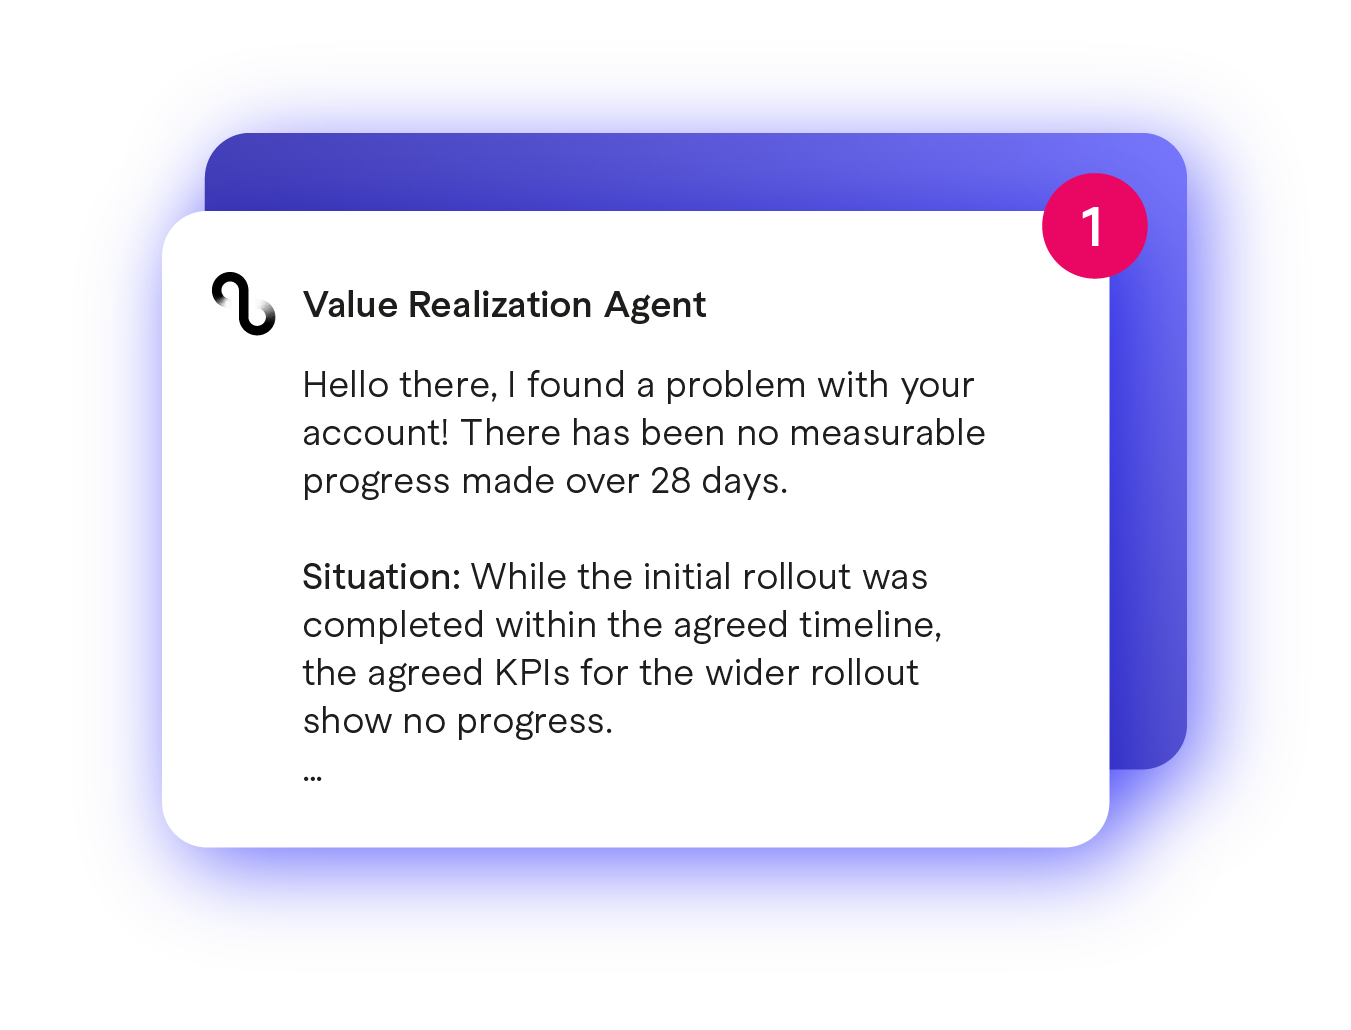
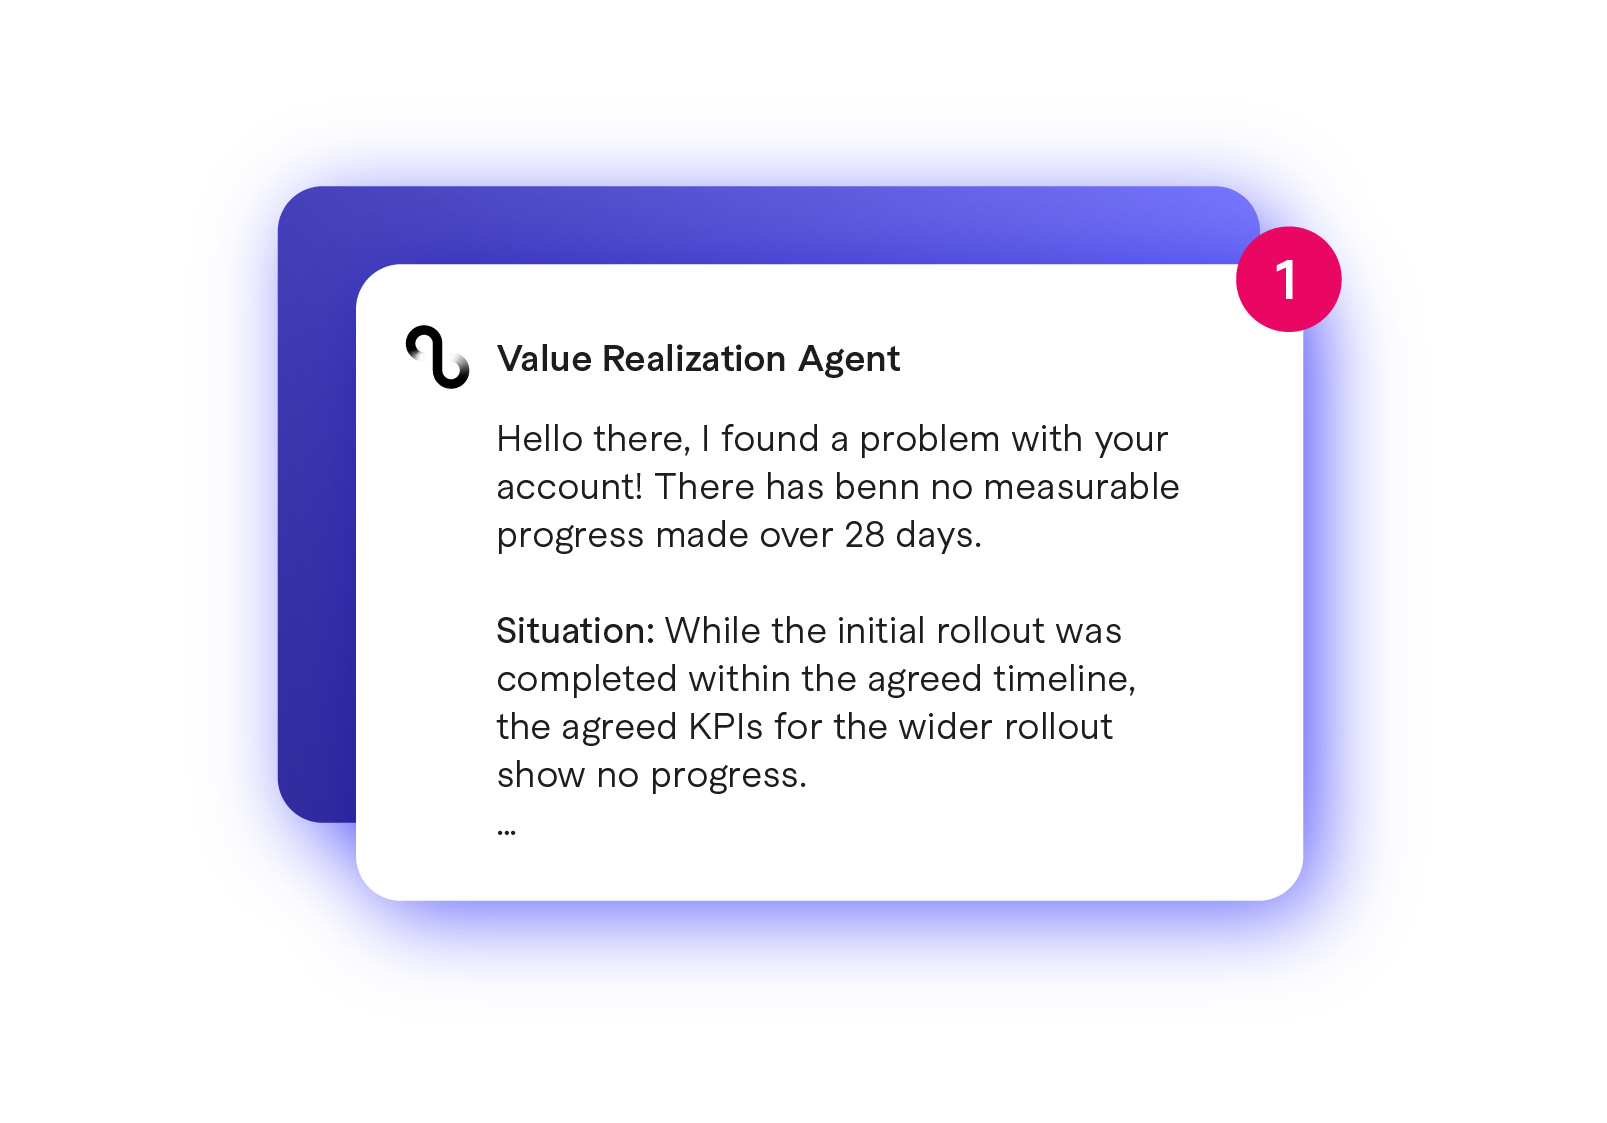
Screenshot of a message from a Value Realization Agent regarding account progress, showing a red notification badge with the number 1.
Notification card with a pink circle containing the number 1, title 'Value Realization Agent', and text about account issues and KPI progress.

02 – The Value Planner

Govern the team while there is still time to act

Realization across the portfolio, by segment, team and CSM, so leadership can spot where value is not landing, intervene on the accounts that matter, and forecast renewal on evidence instead of sentiment.

  • Realization rate by segment, team and CSM

  • Accounts at risk ranked by unrealized value, not by ticket volume

  • Evidence-based input for renewal and expansion forecasting
A corporate presentation slide with a gradient blue background, showing a bar chart with three bars increasing in height, and a '+' sign with '7%' above the tallest bar. The slide title is 'Improve NRR', and the caption explains that managing value realization post hoc can increase net revenue retention, which is key for valuation.
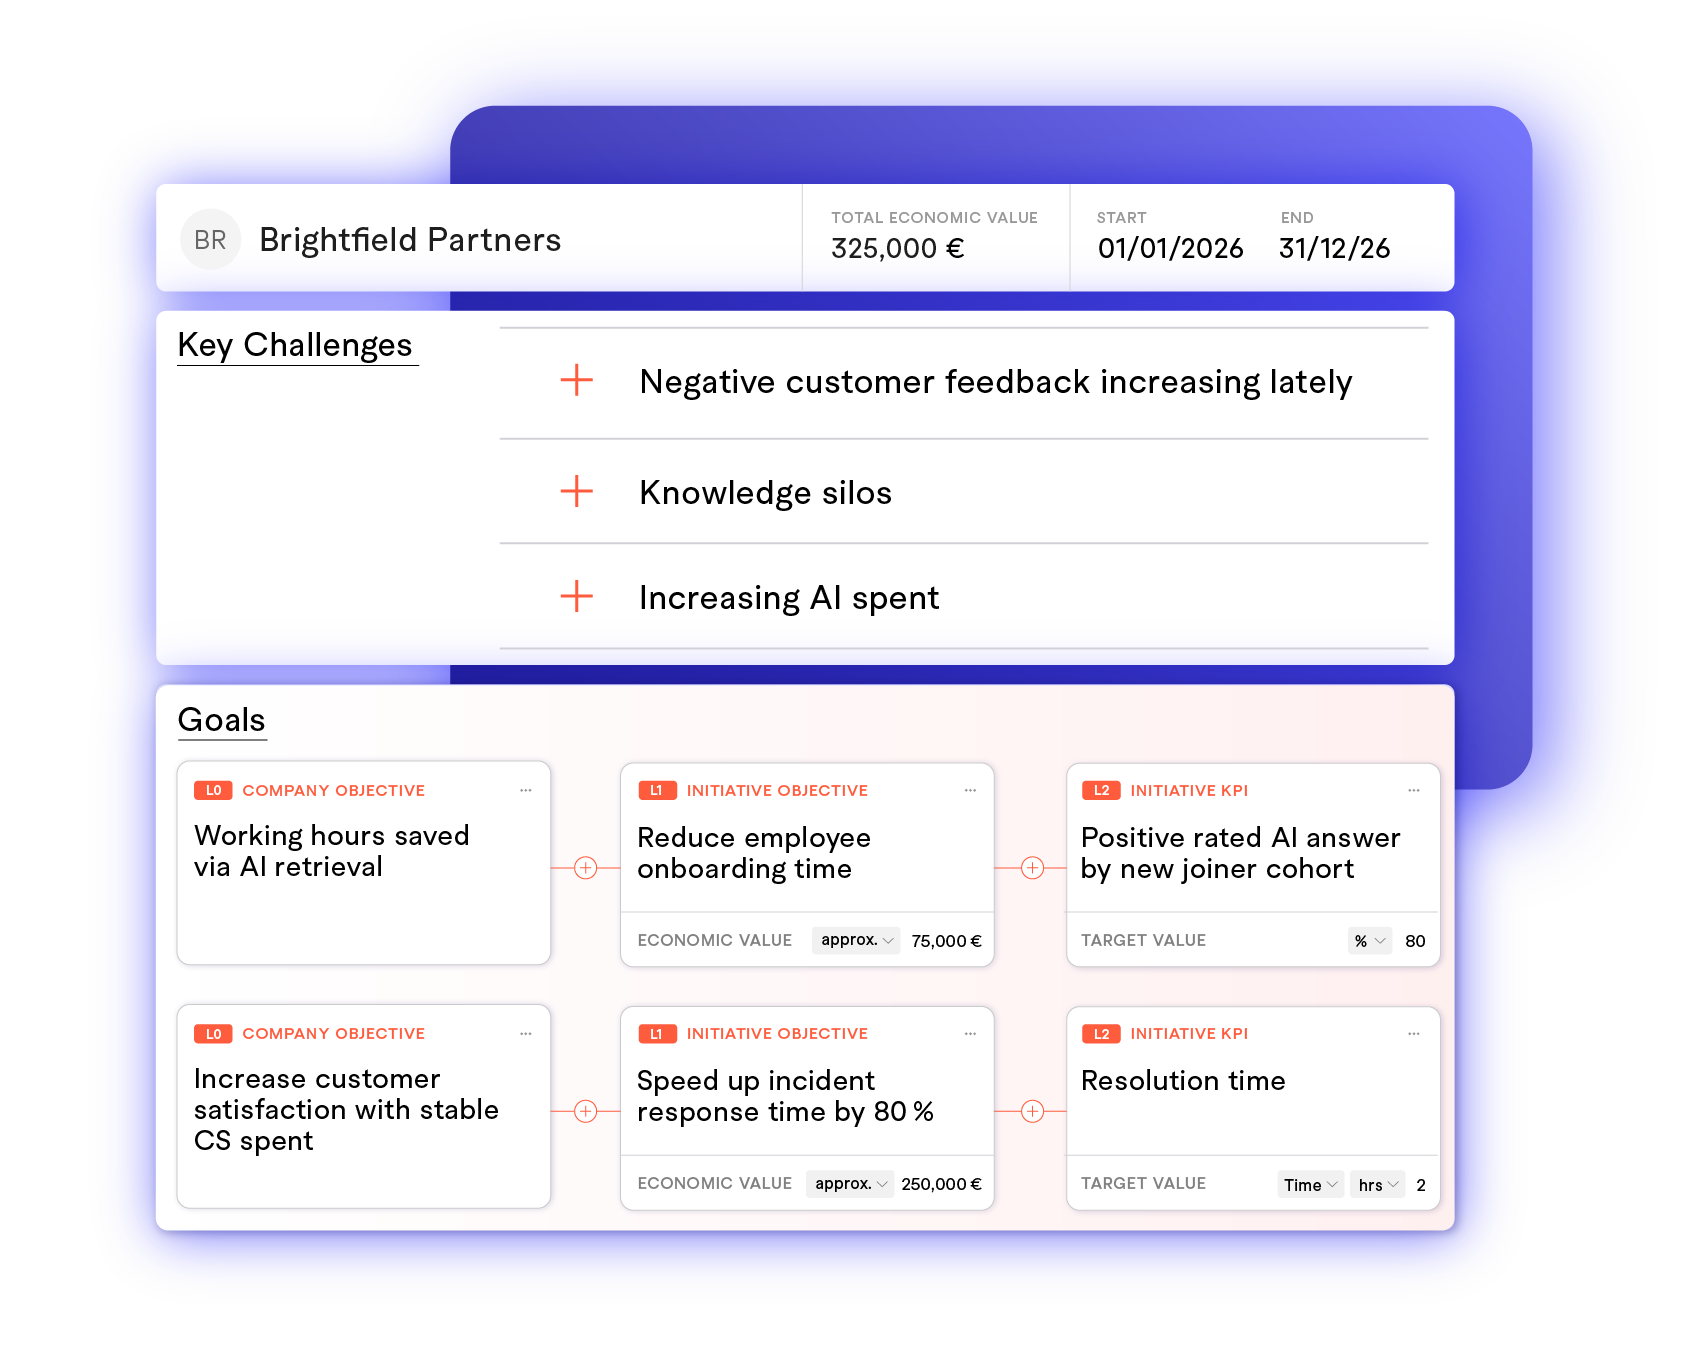
A digital dashboard displaying a project overview for Brightfield Partners, including key challenges such as negative customer feedback, knowledge silos, and increasing AI expenditure. It also highlights goals like saving working hours via AI retrieval, reducing onboarding time, increasing customer satisfaction, and speeding up incident response time.

Sales and post-sales working on one shared plan

One value framework, one vocabulary, one artifact. What the account executive discovered and promised is exactly what the CSM picks up and nothing needs get re-discovered, nothing quietly drops.

  • Shared value framework The same outcome hierarchy, metrics and proof standards used in the deal and after it.

  • Structured handover Business case, baselines, stakeholders and risks are defined together, not thrown over a fence.

  • Defined rituals Who runs the value review, when, with whom, and what evidence has to be on the table.

Graphic showing an upward arrow with a +10% increase, accompanying text about selling faster and increasing new bookings, and a description about a quantified business case supporting this approach.

03 – The Proactive AI Assistance

Information about the importance of strong references, highlighting that customers with documented outcomes give more references and case studies, emphasizing the value of advocacy in marketing.
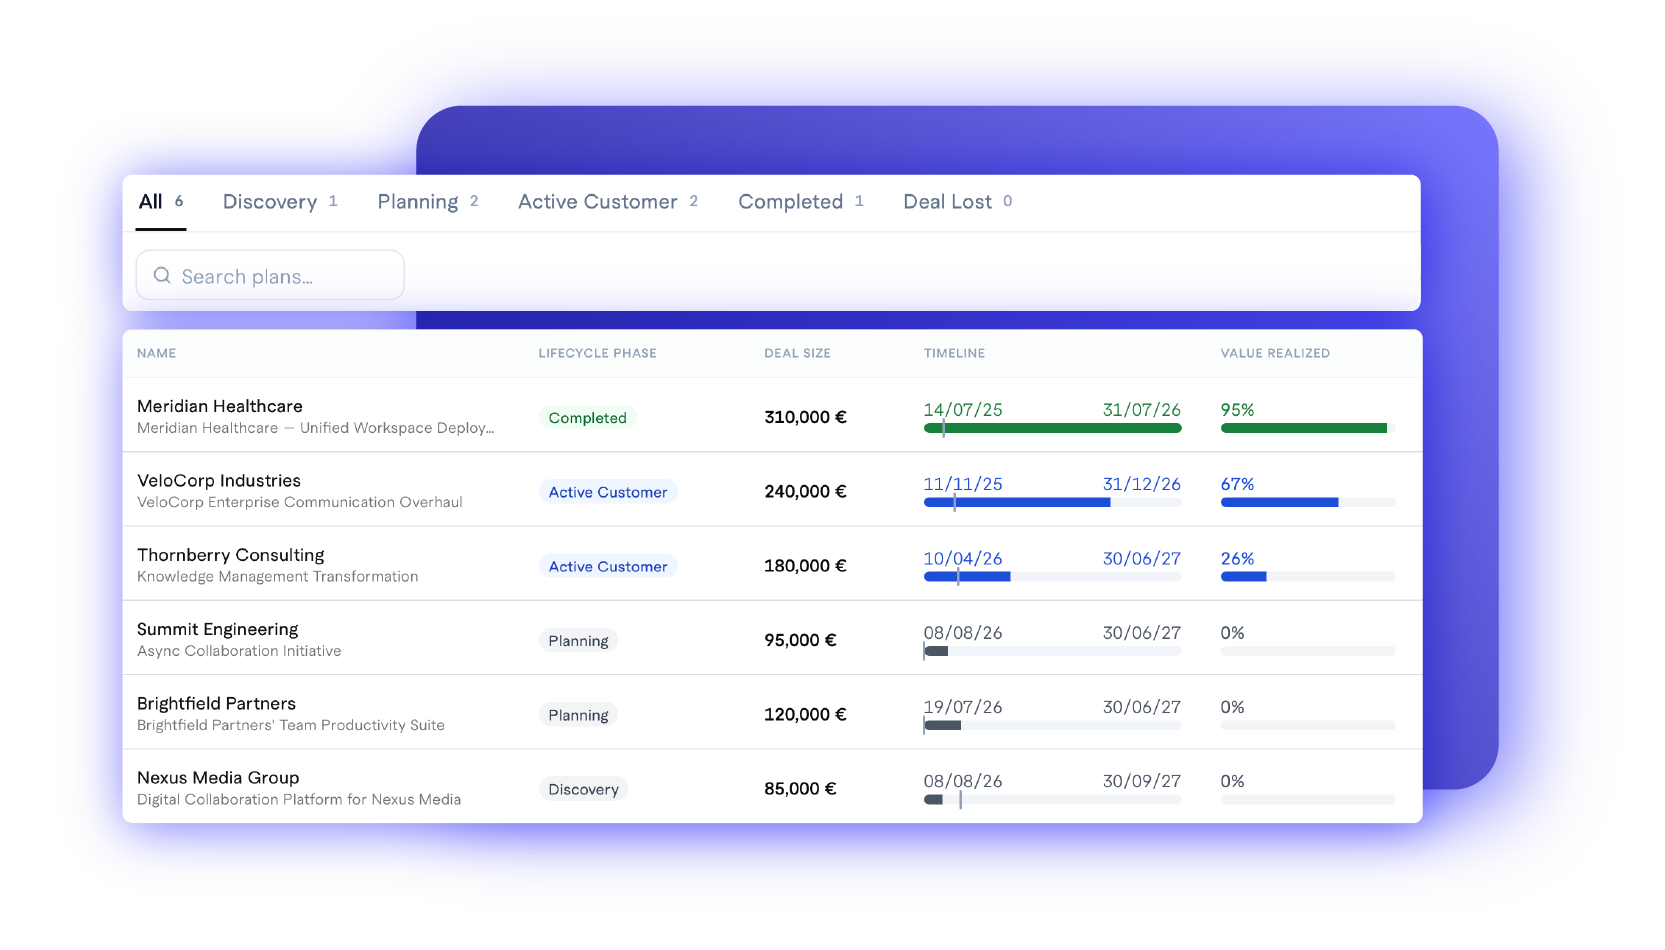
A digital project management dashboard showing various plans and their details, including status, deal size, timeline, and value realized, with a purple background.

04 – Reporting for GTM & CS Leaders

Act before the plan goes quiet

Value plans decay when nobody has time to chase them. The assistant watches every plan and prompts the owner with the specific next move, especially in case of lacking value realization.

  • Flags stalled milestones, missing baselines and unengaged decision makers

  • Drafts the value review narrative from the account’s own evidence

  • Suggests the expansion case when an outcome is proven
Diagram showing data input, database, and output.

05 – The Value Database

Every delivered outcome becomes your asset

Proven outcomes, benchmarks and the plays that produced them accumulate in one place. Sales quotes real numbers from comparable customers, post-sales starts from a plan that already worked, and the business case gets sharper with every renewal.

Our Customers

Logo mit Herz und Bogen, Text: Ich KEEUNT SMART LEARNING.
Das Logo von COMAN SOFTWARE, bestehend aus einer geometrischen, quadratischen Gestaltung in Schwarz, Weiß und Grau, neben dem Text "COMAN SOFTWARE" in Großbuchstaben.
Logo mit sechs weißen Dreiecken, arranged in einer Pyramide, und dem Text 'modell machen' darunter, auf schwarzem Hintergrund.
Logo des Unternehmens Langdock mit schwarzem Hintergrund, weißem Schriftzug und grauem Pfeilsymbol auf der linken Seite.

Contact


addressable value GmbH
Knesebeckstraße 59–61
10719 Berlin

info@addressablevalue.de

Curious? Benchmark your value maturity with a quick self-assessment:

Or reach out directly: